Analyze and visualize data professionally with SimAssist
With SimAssist you can understand and visualize the interrelation in your data. With just a few clicks, you can create meaningful charts that you can not only design individually, but also transfer to your PowerPoint presentation at the touch of a button.
You are currently viewing a placeholder content from YouTube. To access the actual content, click the button below. Please note that doing so will share data with third-party providers.
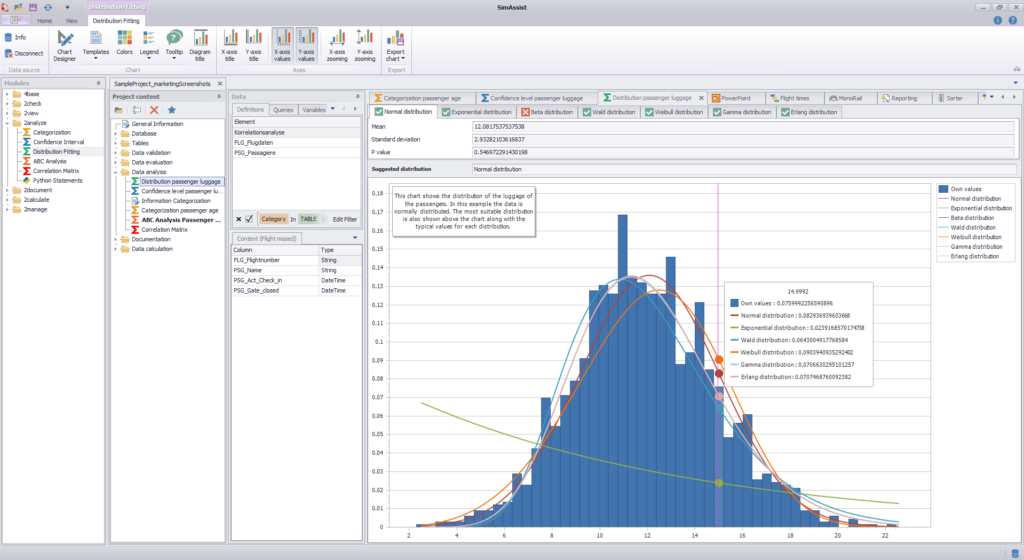
More InformationWhether production, logistics or process data – SimAssist helps you to identify statistical trends. In addition to the tabular and graphical presentation of data, you can use statistical analysis methods such as ABC analysis or the determination of the confidence interval. You can use your own SQL queries to filter and compile the data according to your needs.
The data can be read in from Excel files or databases such as Oracle or SQLite. ODBC data sources can also be used.
SimAssist integrates your individually developed plug-ins
If the standard functions for data analysis are not sufficient, you can develop and integrate your own applications. Of course, we will support you in your individual project.
SimAssist was developed for the evaluation of simulation results
The recognition of statistical correlations and a thorough analysis of the result data are decisive for success in simulation projects. SimAssist has become the standard tool for simulation users and today offers almost all functions required for comprehensive result evaluation and presentation. Even if you want to use SimAssist for other purposes, you will benefit from the powerful analysis functions.
Would you like to learn more?
You want to test SimAssist for your individual application first? Then request a free test license. We recommend that you attend one of our training courses to learn how to use SimAssist quickly and efficiently.